Abstract
Corruption robustness and deployment quantization
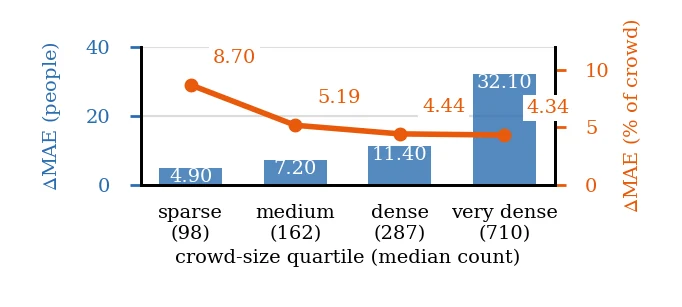
Crowd-counting models deployed on edge devices face two shifts: inputs are degraded along the capture and transmission pipeline, while models are quantized to satisfy resource constraints. Yet corruption robustness and deployment quantization are typically evaluated separately. We introduce CrowdCC, a benchmark that jointly evaluates these effects using 23 deployment-motivated corruptions at three severity levels, four crowd-counting datasets, and 26 models using TensorRT engines at FP32, FP16, and post-training INT8 precision. The corruptions span six families, with head annotations adjusted when geometry or visibility changes. Our evaluation shows that capture-chain corruptions consistently produce the largest degradation across the evaluated models, while crowd density affects absolute and relative error differently. Clean accuracy does not fully predict corrupted performance, and models with similar corrupted error can exhibit different degradation relative to their clean baselines. INT8 alters corruption robustness substantially more than FP16, with no systematic direction, and does not consistently improve latency or energy. INT8 inference efficiency is strongly associated with reformat overhead in the compiled engine, while slowdowns are also observed under limited INT8 coverage. These results show that corruption robustness and deployment efficiency should be evaluated jointly on the deployed system.
Corruption families in the deployment pipeline
Four families act during image formation and delivery; scene clutter and visibility loss act on the scene beforehand. The deployed engine produces the count using FP32, FP16 or INT8 precision. Click a family to open it in the explorer.
The benchmark
23 corruptions across six families and three severity levels
Each corruption is physically parameterized and calibrated relative to the scene where scale matters, for example blur measured in units of the median head spacing, and haze following scene depth. Click any corruption to open it in the explorer.
Annotation transformations. Seven corruptions change what can be counted. CrowdCC transforms the head annotations with the pixels and scores every corrupted image against the heads that remain visible. To keep all cells on the clean count scale, the error is normalized by the visible-head fraction, MAEkept = MAE / (1 − fdrop). Across these settings the median removed fraction is 9.4%. View annotation changes →
Explore
Compare clean and corrupted images
Eight test scenes from the four datasets, each rendered under all 69 corruption settings. The left side is the original image and the right side is the corrupted one. Use the arrow keys to step through the corruptions.
Annotations
Annotation changes under corruption
Seven corruptions change what can be counted, and CrowdCC moves or removes the head annotations with the pixels. On the left is the original annotation, with the heads the corruption removes marked ×. On the right is the corrupted image with the label it is scored against. Hover over either image (or tap it on a touch screen) to magnify both at the same spot.
Fraction of annotations removed by corruption
Share of annotated heads removed from the label over the whole test split, per severity. Scores on these cells use MAE / (1 − fdrop) to account for the fraction of annotations removed.
Findings
Key findings
The evaluation covers 26 models × 4 datasets × 3 precisions × 23 corruptions × 3 severities, each on the full test split.
Capture-chain corruptions cause the largest degradation
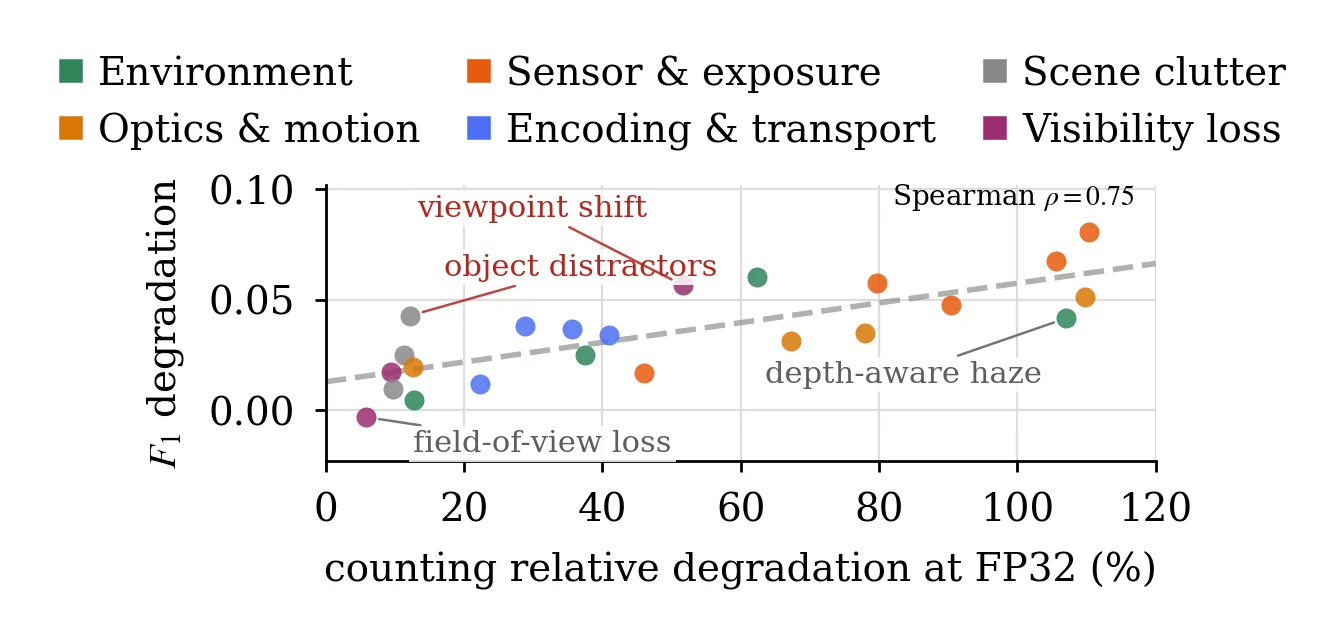
Far-field defocus raises error the most, averaged over all models and datasets, followed by highlight clipping, depth-aware haze and Gaussian noise. The nine most damaging corruptions all arise during image formation and transmission. Cast shadow is the mildest, at +11.5%.
Clean and corrupted performance rankings differ
The model with the lowest clean MAE is not the model with the lowest corrupted error (mcMAE) on three of the four datasets. Median relative degradation ranges from 12.2% (CCST) to 30.4% (MobileCount), yet neither has the lowest corrupted error on any dataset.
INT8 produces larger robustness changes than FP16
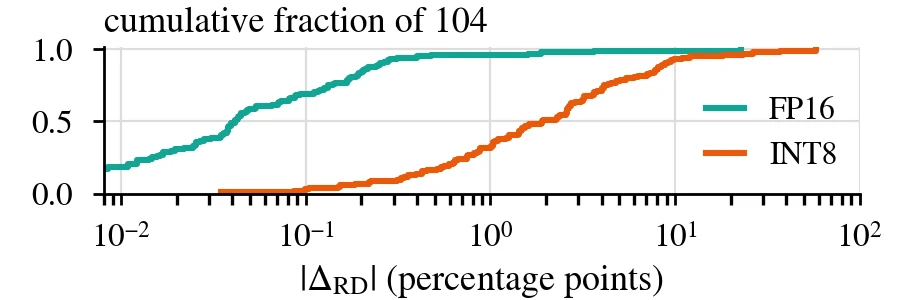
The median absolute change in relative degradation versus FP32 is 1.91 percentage points for INT8 and 0.04 for FP16. INT8 deviates more in 102 of 104 model–dataset pairs, so the shift is primarily associated with quantization rather than with TensorRT compilation.
INT8 effects vary across models and datasets
INT8 lowers relative degradation in 60 comparisons and raises it in 44, which a sign test cannot distinguish from an even split (p = 0.141). Whether quantization improves or reduces robustness depends on the model and the dataset.
INT8 is not always faster
On the Jetson Orin NX, INT8 is slower than FP16 in 17 measurements, 13 of which also use more energy. Lower speedup is strongly associated with reformat overhead: TensorRT reformat layers per GMAC of model complexity (Spearman ρ = −0.82).
Energy–robustness trade-offs
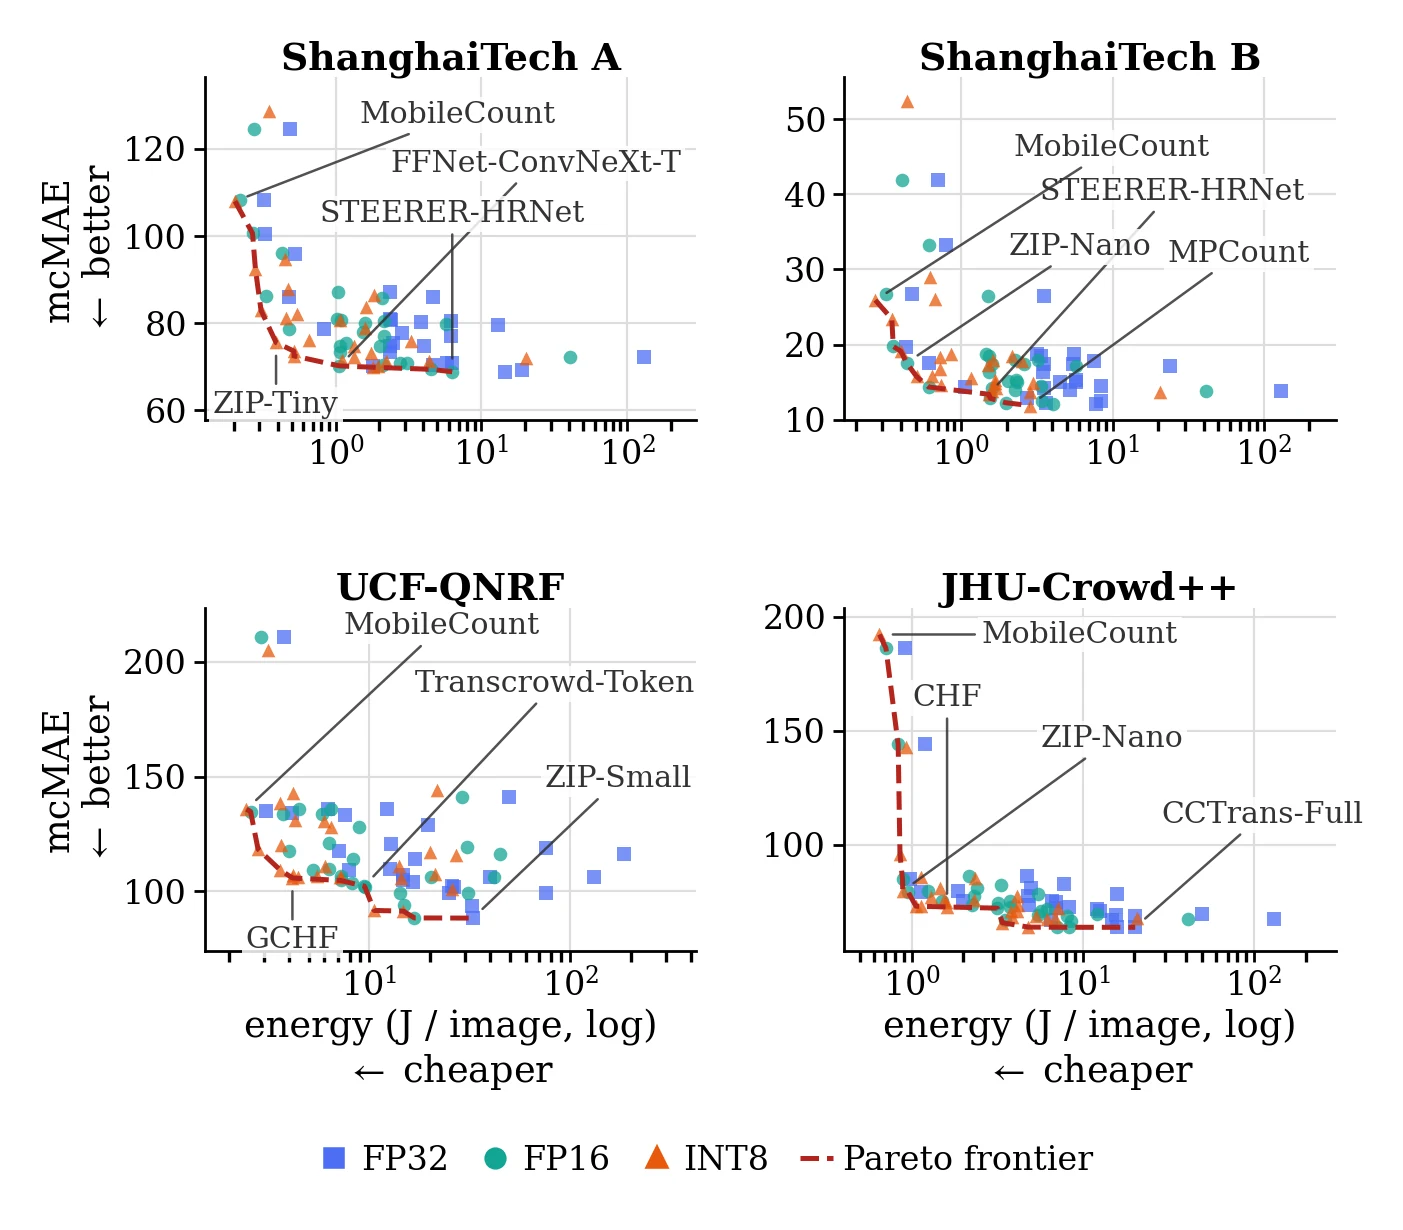
Energy per image varies by nearly three orders of magnitude on the same device. Seven INT8 models form the energy–robustness Pareto frontier. MCNN and ZIP-Tiny have median INT8 energy consumption of 0.68 and 0.78 J/image, respectively; MCNN has 2.25× the mean mCE of ZIP-Tiny across the four datasets.
Relative degradation by corruption
Mean relative degradation (RD, %) per corruption, averaged over models and severities, then over datasets. Bars are coloured by family.
Energy consumption and corruption robustness
Each point is one model at one precision. Energy is the median over the four datasets (J/image, log scale) and mCE the mean over them (CSRNet = 1, lower is better). The line marks the Pareto frontier.
Leaderboard
Evaluation of 26 deployed models
Clean and corrupted error of every model on each dataset at each precision. Each model is evaluated using a TensorRT engine at the selected precision (INT8 by post-training quantization). Accuracy is measured on the full test split and energy on a Jetson Orin NX. Click a column header to sort.
Swipe sideways for all columns →
mcMAE: mean over the 23 corruptions of the severity-averaged MAEkept. RD: relative degradation, (mcMAE − clean) / clean. mCE: mean over corruptions of the model's error divided by CSRNet's, on the same dataset and precision. ΔRD: the change in RD from FP32 to this precision. Energy: J/image on a Jetson Orin NX (40 W mode), over a stratified 100-image subset. ★ marks the best value in each column.
Rankings by corruption
Model performance by corruption
Relative degradation of every model under every corruption. Click a corruption (column) to rank the models by it, or pick one on the right.
Swipe sideways for all corruptions →
Software
Benchmark generation and model evaluation
The crowdcc package generates the benchmark from the original datasets. Generation is deterministic and needs no GPU, except the optional depth maps. It then scores any model's predicted counts with the paper's metrics. Dataset images are not redistributed; download them from their authors.
Install
Python ≥ 3.10. The lockfile pins the library versions the published benchmark was built with.
git clone https://github.com/Tulane-Computer-Architecture-Systems/CrowdCC-Release
cd CrowdCC-Release
pip install -r requirements-lock.txt
pip install -e .
Generate
All 23 corruptions × 3 severities for a test split, each image with its transformed annotations. Before running crowdcc depth, follow the depth dependency installation instructions.
# depth maps for two corruptions (GPU)
crowdcc depth --dataset sha \
--root data/ShanghaiTech/part_A --out out
crowdcc generate --dataset sha \
--root data/ShanghaiTech/part_A --out out
Evaluate
Write one predicted count per image, then compute clean MAE, mcMAE, RD and mCE against CSRNet.
python examples/predict.py \ --benchmark out/sha/test --dataset sha \ --root data/ShanghaiTech/part_A \ --model my_model:count --out preds.csv crowdcc evaluate --benchmark out/sha/test \ --predictions preds.csv
Citation
BibTeX
If you use CrowdCC, please cite the paper, together with the datasets you evaluate on.
@inproceedings{hasan2027crowdcc,
title = {CrowdCC: Jointly Benchmarking Corruption Robustness and
Deployment Quantization in Crowd Counting},
author = {Hasan, S Mahmudul and Peng, Lu},
booktitle = {Proceedings of the IEEE/CVF Winter Conference on
Applications of Computer Vision (WACV)},
year = {2027}
}